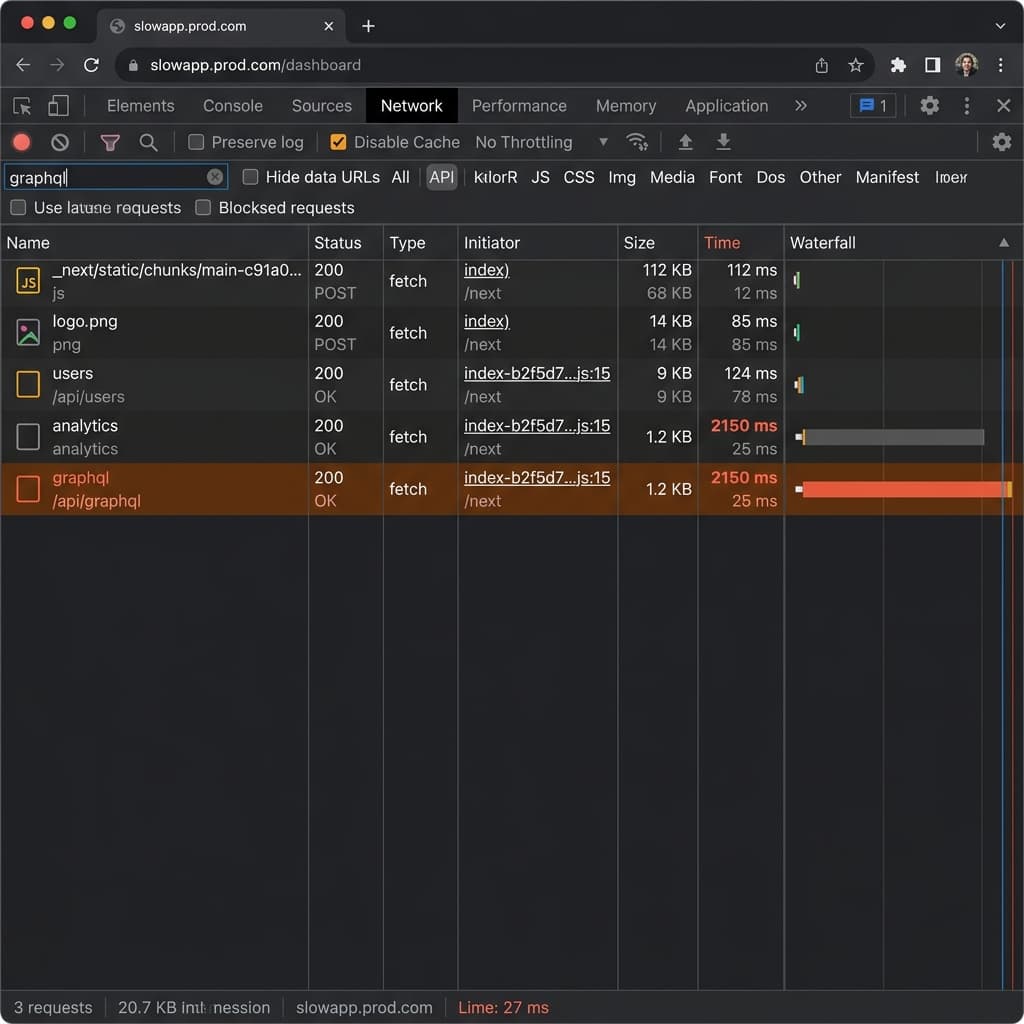
Mastering AI-Assisted Debugging in Modern Next.js Applications
Learn how to leverage AI tools and built-in Next.js features to identify, isolate, and resolve complex bugs in Server Components and Edge environments faster.
Mastering AI-Assisted Debugging in Modern Next.js Applications
In 2026, the complexity of modern web applications—especially those utilizing Next.js Server Components, Edge runtimes, and intricate state management—demands a fresh approach to debugging. Traditional console.log debugging simply doesn't cut it when dealing with streaming SSR or distributed edge functions. This is where AI-assisted debugging steps in.
The Shift from Stack Traces to Semantic Analysis
Gone are the days of staring blankly at a convoluted stack trace spanning twenty node modules. Today's AI tools integrate directly into your IDE, capable of interpreting the semantic meaning behind an error within the exact context of your Next.js application.
Why Next.js Debugging is Unique
Next.js introduces paradigms that challenge traditional debugging:
- React Server Components (RSC): Code executes on the server, meaning browser DevTools are blind to the initial render logic.
- Streaming & Suspense: Responses arrive in chunks. Tracing exactly when and where a specific piece of data failed requires timeline analysis.
- Edge Runtimes: The Node.js environment you test locally might not perfectly mirror the limited APIs available at the Edge.
The AI Debugging Workflow
Integrating AI into your workflow isn't just about asking a chatbot "why doesn't this work?" It involves a systematic approach:
1. Contextual Error Capture
Modern tools like Cursor or GitHub Copilot Workspace allow you to highlight a specific error block directly in your terminal or IDE. By capturing the error along with the surrounding code and the framework context (knowing it's a Next.js App Router project), the AI can immediately rule out generic Node.js solutions that don't apply.
2. Hypothesis Generation
When an obscure hydration error occurs ("Text content does not match server-rendered HTML"), the AI can generate multiple hypotheses based on common Next.js pitfalls, such as:
- An unsuppressed
useEffectattempting to modify DOM before hydration completes. - Inconsistent date formatting between server and client.
- Improper use of
suppressHydrationWarning.
3. Automated Remediation
Instead of manually typing out the fix, AI agents can propose inline code changes. For instance, if a Server Action is throwing a CORS error because it wasn't properly annotated, the AI can automatically suggest adding the "use server" directive in the appropriate file boundary.
Best Practices for AI Debugging
To get the most out of AI assistants, you need to provide the right environment:
- Type Everything: TypeScript is the AI's best friend. Strong typing gives the LLM deterministic context about what data structures should look like, significantly improving the accuracy of its debugging suggestions.
- Isolate Reproductions: If you're dealing with a complex state issue, isolate the component. Asking an AI to debug a 1000-line file is less effective than asking it to debug a minimal reproducible example.
- Use Source Maps: Ensure source maps are correctly configured in your
next.config.ts. The AI needs to see your original source code, not the minified Webpack output.
Conclusion
AI-assisted debugging doesn't replace the need for strong fundamental knowledge of React and Next.js. However, it acts as an incredibly powerful pair programmer, drastically reducing the time spent deciphering cryptic errors and allowing you to focus on building features. By integrating these tools into your daily workflow, you can confidently navigate the complexities of modern web development.
Related
Resources
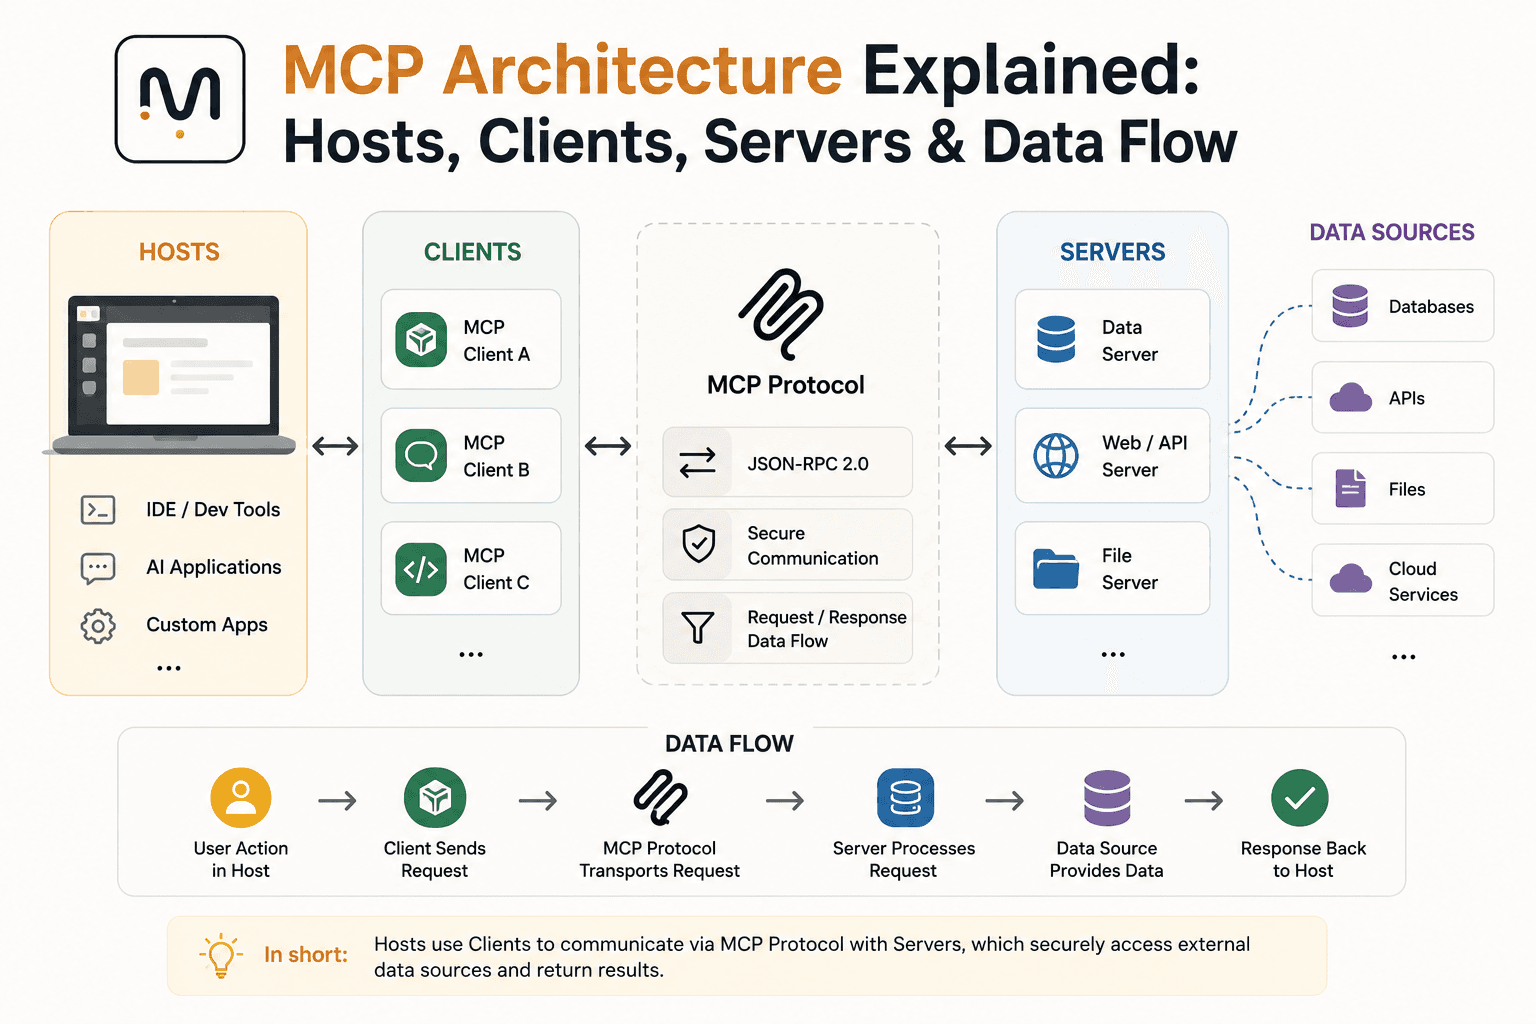
MCP Architecture Explained: Hosts, Clients, Servers & Data Flow
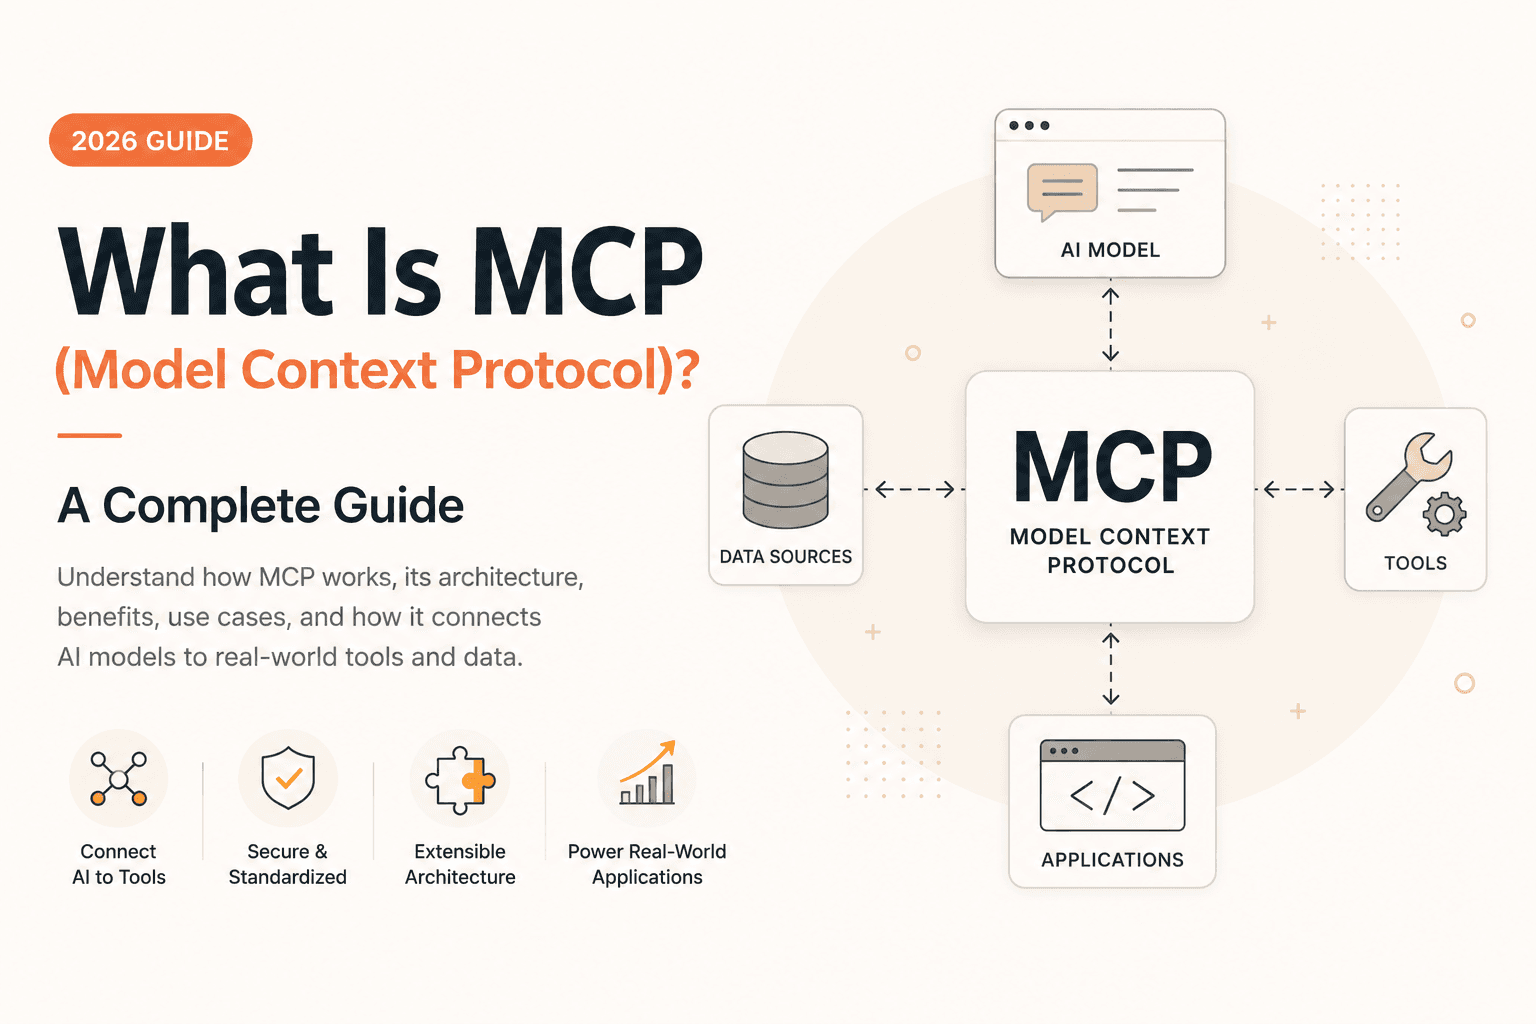
What Is MCP (Model Context Protocol)? A Complete Guide (2026)

OpenRouter API Tutorial: How to Connect & Fetch LLM Responses (JS/Node.js)
The Best AI Tools for Developers in 2026