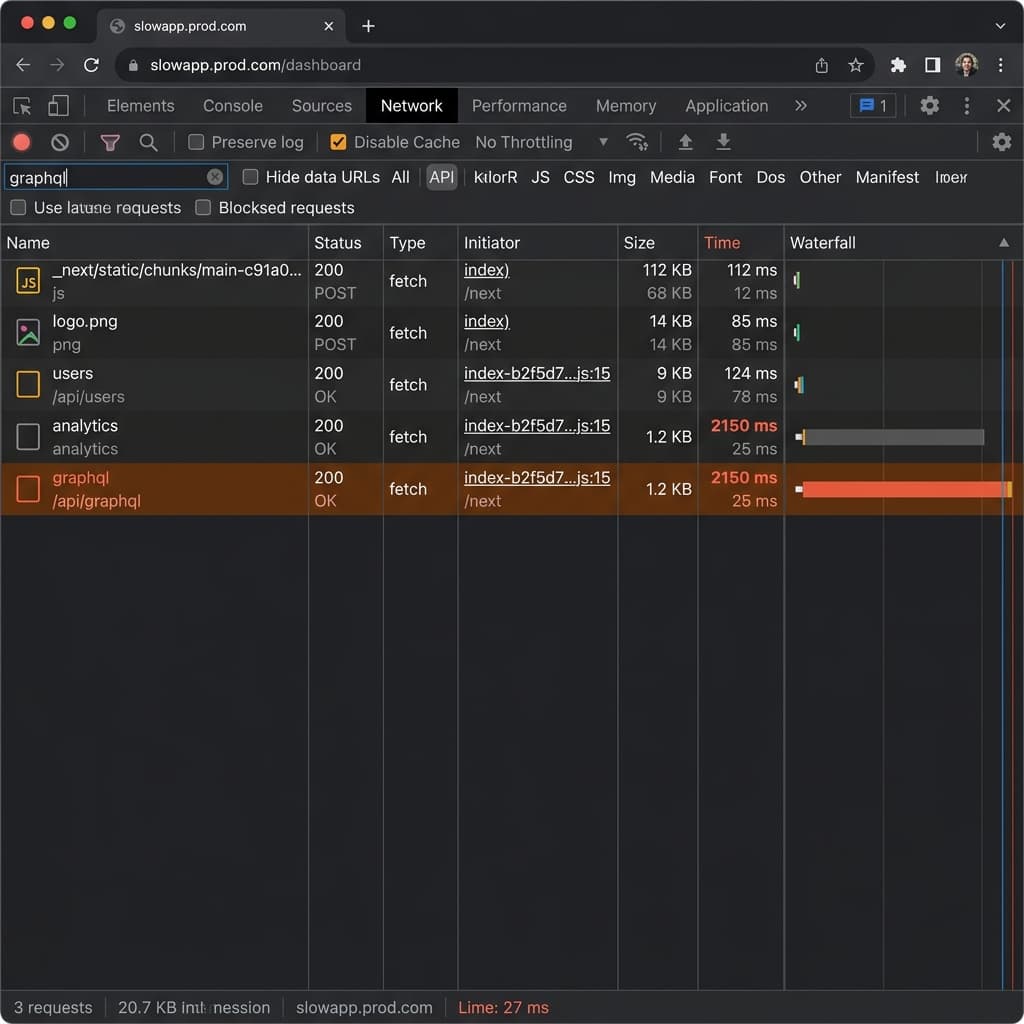
How to Optimize Supabase & PostgreSQL Performance (2026)
Slow Supabase queries? Fix connection exhaustion, tune indexes, configure Supavisor & RLS to cut query latency in production.
How to Fix Slow Supabase Queries: A Complete PostgreSQL Performance Guide
Supabase is a joy to use, no doubt about it. But here's the harsh truth: when your app starts getting real traffic, those "naive" queries you wrote during the MVP phase will come back to bite you. Slow page loads, connection timeouts, or worse — taking down your entire app.
If you're here because you searched "why is my Supabase query slow" or "Supabase connection exhausted," you're in the right place. This guide skips the theoretical textbook stuff. These are real-world lessons — and a few battle scars — from optimizing Supabase across the database, the auto-generated API, and Edge Functions.
Quick answer: most slow Supabase queries come down to one of five causes — missing indexes, unbounded select('*') calls, complex RLS policies, connection pool exhaustion in serverless environments, or the database doing work it shouldn't (like external API calls). Fix those five, and you've solved 90% of production performance issues. Let's go through each one.
1. How to Add Indexes in Supabase to Fix Slow Queries
Trust me: 90% of your slow queries are because you forgot to add an index, or put it in the wrong place. Postgres (the engine under Supabase's hood) is incredibly powerful, but if you force it to run a sequential scan on a massive table, it's going to cry — and so will your users, staring at a loading spinner.
Battle-tested tips:
-
Stop guessing. Open the Index Advisor in your Supabase Dashboard (Database → Query Performance) immediately. It literally points out which queries are choking because of missing indexes.
-
Foreign keys are mandatory. If you have an
orderstable pointing tousers, index theuser_id. Otherwise, everyJOINscans the entire table.CREATE INDEX idx_orders_user_id ON orders(user_id); -
Partial indexes — the secret weapon. If you frequently query for online users, don't index the entire status column. Use a partial index — it's lightweight and lightning fast:
CREATE INDEX idx_active_users ON users(status) WHERE status = 'active'; -
Composite indexes for multi-column filters. If a query always filters by
user_idANDcreated_at, a single composite index beats two separate ones:CREATE INDEX idx_orders_user_created ON orders(user_id, created_at DESC);
2. Why Is PostgREST Slow? Stop Abusing the Auto-Generated API
Supabase auto-generates a slick API on top of Postgres called PostgREST. It's incredibly convenient, but shockingly easy to abuse — and abuse is the #1 cause of slow PostgREST response times.
Kick the select('*') habit. When you're building a quick demo, sure, whatever. But in production, calling select('*') is like downloading an entire encyclopedia just to read the table of contents. It also drags in large columns (JSON blobs, text fields) you don't need, inflating payload size and response time.
// ❌ Re-evaluate your life choices
const { data } = await supabase.from('users').select('*');

// ✅ This is the way
const { data } = await supabase.from('users').select('id, name, avatar_url');
No pagination? You're asking for trouble. Are you absolutely certain that table will only ever have 10 rows? If not, always append .range() or .limit(). No exceptions — an unbounded query today is a full table scan next quarter.
const { data } = await supabase
  .from('orders')
  .select('id, total, created_at')
  .order('created_at', { ascending: false })
  .range(0, 49); // page 1, 50 rows
Watch for N+1 patterns. Fetching a list and then looping over it to fetch related data per row is a classic cause of "PostgREST slow response" complaints. Use embedded resource queries instead:
// ✅ One round trip instead of N+1
const { data } = await supabase
  .from('orders')
  .select('id, total, users(name, email)');
3. Why Is Supabase RLS Slow? How to Optimize Row Level Security
RLS is arguably Supabase's killer feature. It saves you from writing a mountain of authorization logic in the backend. But the downside: RLS policies are evaluated on every single row returned. This is the single most common cause of "why is my Supabase RLS query timing out" reports.
If you write a policy with complex subqueries or joins, your query speed will absolutely tank.
-- ❌ Your users will be waiting forever
CREATE POLICY "View same department data" ON data
FOR SELECT USING (
  department_id IN (SELECT department_id FROM users WHERE id = auth.uid())
);
The fix:
- Design your tables so RLS checks are as simple as possible — ideally comparing a column directly to a value from the JWT (
auth.uid(),auth.jwt()), not running a subquery per row. - If the logic is unavoidably complex, use a Security Definer Function: a Postgres function that runs with elevated privileges to fetch the data, bypassing the expensive per-row check. Use this carefully and audit it — it intentionally sidesteps RLS.
- Index the columns your RLS policies filter on. An RLS policy without a supporting index forces a scan on every request, even simple ones.
4. How to Fix "Supabase Connection Exhausted" Errors with Supavisor
If you're using Next.js API routes, Cloudflare Workers, or any serverless function to hit Postgres directly, you will inevitably see the terrifying error: connection exhausted / remaining connection slots are reserved.
Here's why: each Postgres connection eats up roughly 10MB of RAM, and Postgres has a hard connection limit. Serverless environments scale aggressively — every cold start can open a new connection, and hundreds of them stack up faster than Postgres can handle.
The solution: turn on Supavisor.
Supabase's built-in connection pooler, Supavisor, sits between your app and Postgres and reuses connections instead of opening new ones per request.
- Transaction mode (port
6543) — best for serverless functions, edge runtimes, and short-lived connections (Next.js API routes, Cloudflare Workers, Vercel Edge Functions). - Session mode (port
5432via pooler) — needed if you rely on session-level features like prepared statements orLISTEN/NOTIFY.
Prisma with Supavisor:
## .env — transaction mode for serverless
DATABASE_URL="postgresql://postgres.[project-ref]:[password]@aws-0-[region].pooler.supabase.com:6543/postgres?pgbouncer=true"
DIRECT_URL="postgresql://postgres.[project-ref]:[password]@aws-0-[region].pooler.supabase.com:5432/postgres"
datasource db {
  provider  = "postgresql"
  url       = env("DATABASE_URL")
  directUrl = env("DIRECT_URL") // used for migrations
}
Drizzle ORM with Supavisor:
import { drizzle } from 'drizzle-orm/postgres-js';
import postgres from 'postgres';

const connectionString = process.env.DATABASE_URL!; // port 6543, pooled
const client = postgres(connectionString, { prepare: false }); // required for transaction mode
export const db = drizzle(client);
Note the prepare: false — transaction-mode pooling doesn't support prepared statements, and this is the #1 reason developers hit weird connection errors even after switching to Supavisor.
5. React Native + Supabase: Fixing Slow Queries on Mobile
Mobile apps hit a different set of Supabase performance problems, and "React Native Supabase slow" is a common search for a reason:
- Over-fetching on flaky networks. The
select('*')mistake hurts more on mobile — every unnecessary byte costs load time on 4G/5G. Be aggressive about selecting only the columns your UI actually renders. - No local caching layer. Re-fetching the same data on every screen focus is a common React Native anti-pattern. Pair Supabase with a client cache (TanStack Query or SWR) so repeat navigations don't re-hit the network.
- Realtime subscriptions left open. Supabase Realtime channels that aren't unsubscribed when a screen unmounts quietly pile up and consume both client and server resources. Always clean up in
useEffect's return function. - Cold start + connection overhead. If you're calling Postgres directly from a backend-for-mobile layer, the same Supavisor guidance in section 4 applies — mobile backends are effectively serverless from Postgres's point of view.
6. Next.js + Supabase: Optimization Checklist
For Next.js specifically, layer these on top of the Supavisor setup above:
- Use the Next.js Data Cache or ISR for data that doesn't change on every request (product pages, public profiles, blog content).
- Keep Supabase client calls in Server Components or Route Handlers where possible — it avoids shipping query logic (and credentials) to the client.
- For frequently-read, rarely-written data, don't hit Postgres at all on every request — see caching below.
7. Don't Force Your Database to Do Everything: Supabase Edge Functions
Some developers use Postgres functions to make external API calls (via pg_net). Don't. Your database should stick to storing and retrieving data. Heavy computation, third-party API calls, and sending emails belong in Supabase Edge Functions — they run close to the edge, have minimal cold starts, and most importantly, don't drag down your primary database's performance.
A minimal Edge Function offloading a task that shouldn't run inside Postgres:
// supabase/functions/send-welcome-email/index.ts
import { serve } from 'https://deno.land/std/http/server.ts';

serve(async (req) => {
  const { email, name } = await req.json();

  await fetch('https://api.resend.com/emails', {
    method: 'POST',
    headers: { Authorization: `Bearer ${Deno.env.get('RESEND_API_KEY')}` },
    body: JSON.stringify({ to: email, subject: `Welcome, ${name}!` }),
  });

  return new Response(JSON.stringify({ success: true }), { status: 200 });
});
Trigger it from a database webhook or directly from your app — either way, your Postgres instance stays free to do what it's good at: querying data.
8. Caching: Upstash Redis + Cloudflare Workers in Front of Supabase Postgres
"The fastest query is the one you don't make." No matter how well you optimize, hitting Postgres still takes time.
-
Rarely-changing data (settings, catalogs, public profiles) → cache with Next.js Data Cache or ISR.
-
Frequently-read, occasionally-written data (leaderboards, counters, session data) → put Upstash Redis in front of Supabase:
import { Redis } from '@upstash/redis'; const redis = Redis.fromEnv(); async function getLeaderboard() { const cached = await redis.get('leaderboard'); if (cached) return cached; const { data } = await supabase.from('leaderboard').select('*').limit(100); await redis.set('leaderboard', data, { ex: 60 }); // 60s TTL return data; } -
Running on Cloudflare Workers? Upstash Redis works well here because it's HTTP-based (no persistent TCP connection needed), which sidesteps the same connection-limit problem serverless Postgres connections run into — pair it with Supavisor for any direct Postgres calls the Worker still needs to make.
9. How to Scale Supabase: A Long-Term Checklist
Once the fixes above are in place, scaling Supabase is mostly about monitoring and incremental tuning, not one big rewrite:
- Enable Supavisor in transaction mode for all serverless/edge connections
- Run the Index Advisor monthly, not just once
- Audit RLS policies for subqueries — replace with JWT claims or Security Definer Functions where needed
- Set up Google Analytics 4 / dashboard alerts on Query Performance for queries exceeding your latency budget
- Move non-database work (emails, webhooks, API calls) to Edge Functions
- Add a caching layer (ISR, Upstash Redis) for read-heavy, infrequently-changing data
- Upgrade compute tier only after the above are done — throwing hardware at unindexed queries is the most expensive fix available
FAQ
Why do I get "Supabase connection exhausted" errors in production?
Because each Postgres connection is expensive (~10MB RAM) and serverless functions open new connections faster than Postgres's connection limit allows. Fix it by routing through Supavisor on port 6543 (transaction mode).
Why is my Supabase RLS policy so slow? RLS runs on every row returned, so subqueries or joins inside a policy multiply your query cost. Simplify policies to compare JWT claims directly, and index the columns the policy filters on.
How do I fix a Supabase timeout error? Timeouts are usually a symptom, not the root cause — check for missing indexes on the query's filter/join columns first, then check whether a complex RLS policy is scanning every row, then check whether you're out of pooled connections (Supavisor).
Do I need Supavisor if I'm not serverless?
If you run a long-lived server (a traditional Node.js server, not serverless functions), you can often connect directly to Postgres on port 5432 since your connection count stays stable. Supavisor becomes necessary once connections scale up and down unpredictably — which is the default in serverless and edge environments.
Optimization is a continuous loop, not a one-time fix. Get it working first, keep an eye on the Query Performance dashboard, and squash bottlenecks as they appear. Happy optimizing, and may your database never crash.
Related
Resources
MCP Architecture Explained: Hosts, Clients, Servers & Data Flow

What Is MCP (Model Context Protocol)? A Complete Guide (2026)

OpenRouter API Tutorial: How to Connect & Fetch LLM Responses (JS/Node.js)

The Best AI Tools for Developers in 2026